Tag Archives: Geologic Map

Happy Geologic Map Day – Earth Science Week 2023

Why are geologic maps important?

The answer cannot be stated any better than the following:

 “The first geology map was prepared to solve practical problems involving the distribution of different types of rocks at and near the Earth’s surface, and that is still the reason geologic maps are made today.  Uses of geology maps first expanded into exploration for natural resources, including minerals and petroleum.  As an example, during World War II, maintaining the supply of strategic minerals became so critical that geologists in the U.S. military were assigned to make geologic maps for mineral exploration.”

“Most building materials, except wood, are from various specific rocks and rock products. The suitability of rocks and unconsolidated surficial materials to support foundations is essential for construction of homes, skyscrapers, dams, bridges, or simply a road. Rocks and unconsolidated surficial materials fundamentally affect the nature of the soil cover and plant growth is related to soil type.”  (Thomas, 2004)

And don’t forget, we are all familiar with spectacular natural disasters, such as earthquakes, volcanoes, storms, and floods! What’s in a geologic map?
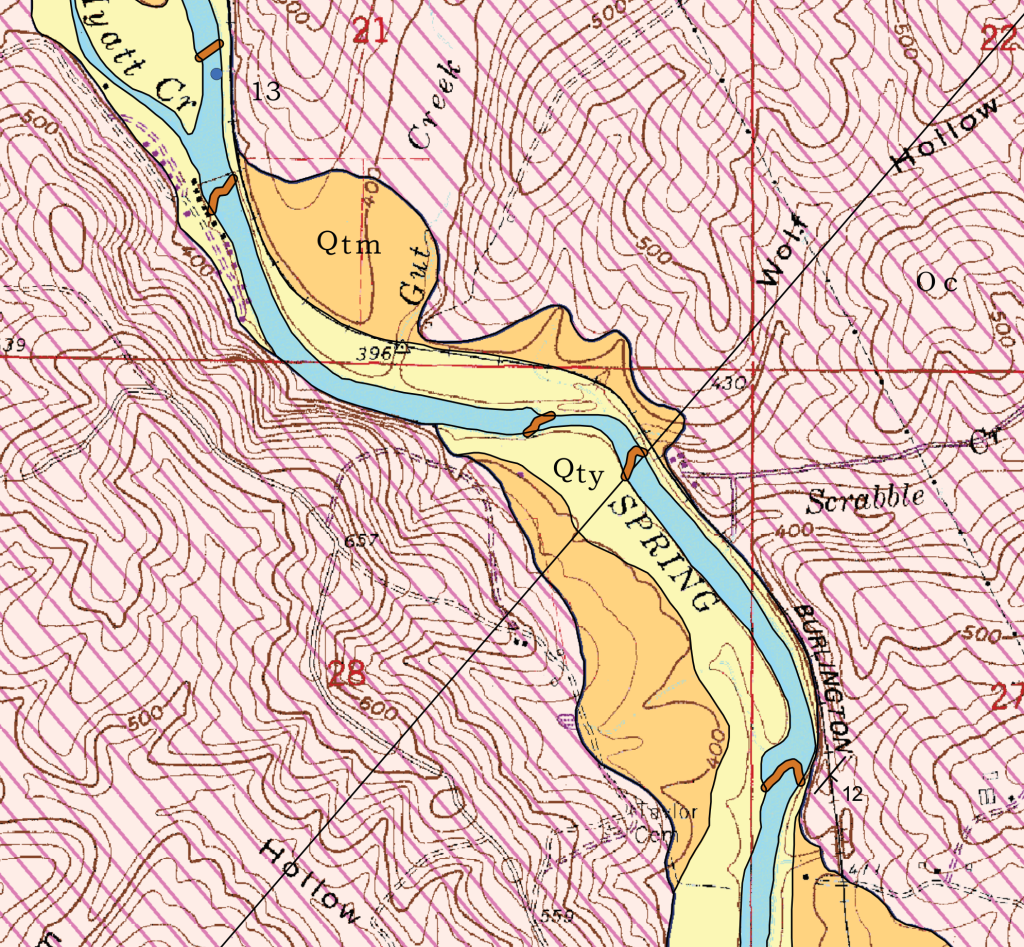
This map is a detail from a larger map, the Geologic Map of the Stuart Quadrangle in northeast Arkansas. This geologic map shows which rock formations and alluvial deposits are exposed at the surface as well as water sample sites, travertine dams, and the orientation of inclined bedding.

The orange and yellow colors (Qty and Qtm) represent alluvium in the form of terraces that were deposited by the Spring River. The brown squiggly lines (Qcd) crossing the Spring River represent travertine dams (Qcd). Travertine dams are made up of the same material as cave deposits, calcium carbonate. They are an important feature to highlight on the map because they can erode and become undercut causing them to become a hazard. The pink patterned color represents the Cotter Formation (Oc). The blue dot near the top of the map labeled “13” represents a water sample site. The symbol at the end of the word “BURLINGTON” is a strike and dip symbol. This symbol indicates that beds of the Cotter Formation at this location are dipping 12 degrees to the southeast.

If you are interested in geologic maps published by the OSG and want to learn more about our mapping program, then visit the link provided below:

https://www.geology.arkansas.gov/geology/arkansas-geological-mapping-program.html

For a full listing of our geologic maps, please visit:

https://www.geology.arkansas.gov/maps-and-data/geologic-maps.html

Reference:  

Thomas, W. 2004, Meeting challenges with geologic maps:  American Geological Institute Awareness Series.

Happy Geologic Map Day!

Why are geologic maps important?

The answer cannot be stated any better than the following:

 “The first geology map was prepared to solve practical problems involving the distribution of different types of rocks at and near the Earth’s surface, and that is still the reason geologic maps are made today.  Uses of geology maps first expanded into exploration for natural resources, including minerals and petroleum.  As an example, during World War II, maintaining the supply of strategic minerals became so critical that geologists in the U.S. military were assigned to make geologic maps for mineral exploration.”

“Most building materials, except wood, are from various specific rocks and rock products. The suitability of rocks and unconsolidated surficial materials to support foundations is essential for construction of homes, skyscrapers, dams, bridges, or simply a road. Rocks and unconsolidated surficial materials fundamentally affect the nature of the soil cover and plant growth is related to soil type. “  (Thomas, 2004)

And don’t forget, we are all familiar with spectacular natural disasters, such as earthquakes, volcanoes, storms,  and floods!

What’s in a geologic map?

The map above is a detail from a larger map, the Geologic Map of the Murfreesboro quadrangle in southwest Arkansas.  This geologic map shows the rocks and alluvial deposits that are exposed at the surface.  Contrasting colors are used to indicate the different rock formations and stream terraces in this area.

The yellow color illustrates alluvium deposited by the Little Missouri River and its tributaries.  Alluvium consists of loose sand and gravel.  This material is an important resource for road construction and other purposes.

During the Cretaceous, a shallow marine ocean covered this area and lime mud was being deposited.  These deposits are represented by the greenish colors and the symbols Kt and Kto, which breaks down into K for Cretaceous, t for Trinity group, and to for Tokyo Formation. But an explosion rocked the area here during the Cretaceous.  An igneous dike pushed up from deep in the earth’s crust, bringing diamonds to the surface.  The blue areas represent exposures of that rare, diamond-bearing igneous rock. The largest blue circle highlights the location of Crater of Diamonds State Park.  Many areas in Arkansas are unique or geologically interesting and have become preserved in our State Parks for all to enjoy!  Folks from all over travel to our state to try their luck at finding diamonds just like the 4.38-carat diamond that was found recently.  Where else can you do that?

So don’t be afraid to look at a geologic map!  Start with a geologic map of the area around your home.  If you need help figuring it out, a friendly geologist is available to help you anytime. Reach out to us at (501)296-1877 or email us at ags@arkansas.gov.

If you are interested in geologic maps published by the Survey and want to learn more about our mapping program, then visit the links provided below:

The Arkansas Geological Survey (AGS) has conducted geologic mapping since the late 1800s.  The first Geologic Map of Arkansas was produced by H.D. Miser and published by the U.S. Geological Survey in 1929.  In the 1960s, the agency was involved with statewide field mapping, which resulted in the publication of the Geologic Map of Arkansas in 1976 and was revised in 1993.

https://www.geology.arkansas.gov/docs/pdf/maps-and-data/geologic_maps/geologic-map-of-arkansas-1993-(34×52).pdf.

The AGS continues to coordinate with other agencies in acquiring supplemental funds for mapping.   Starting in the early 1990s the AGS began geologic mapping at a 1:24,000 scale under the U. S. Geological Survey’s National Cooperative Geologic Mapping Program. The STATEMAP Program provides matching funds for completion of maps in various parts of the state.  Present mapping is focused on the Bethesda, Batesville, Sulphur Rock, and Charlotte quadrangles in  Independence County. 

http://ncgmp.usgs.gov.  

For a full listing of our geologic maps, please visit:

https://www.geology.arkansas.gov/maps-and-data/geologic-maps.html

Reference:  Thomas, W. 2004, Meeting challenges with geologic maps:  American Geological Institute Awareness Series.

 www.agiweb.org/pubs